Data Overview
List of Available Datasets (PDF) - Last updated 11 May 2015
CZO datasets are a powerful resource for developing and testing Earth system models. CZOs produce a large volume of data from a wide range of physical, chemical, and biological disciplines as well as spatial and temporal scales. This "flood" of disparate observational data partly reflects a new generation of integrated measurements. For example, most CZOs are using LIDAR imagery, copious isotopic samples, and low-cost sensors; others are also using eddy correlation and embedded sensor networks.
This research site, the focus of National Science Foundation-supported research since the 1970s, has comprehensive datasets on distributed water budgets (1970-75), has served as a model test bed for hydrological response (1998-present), and is augmented here by new geochemical, geomorphological, ecological, lidar, and soils datasets, all available to the research community.
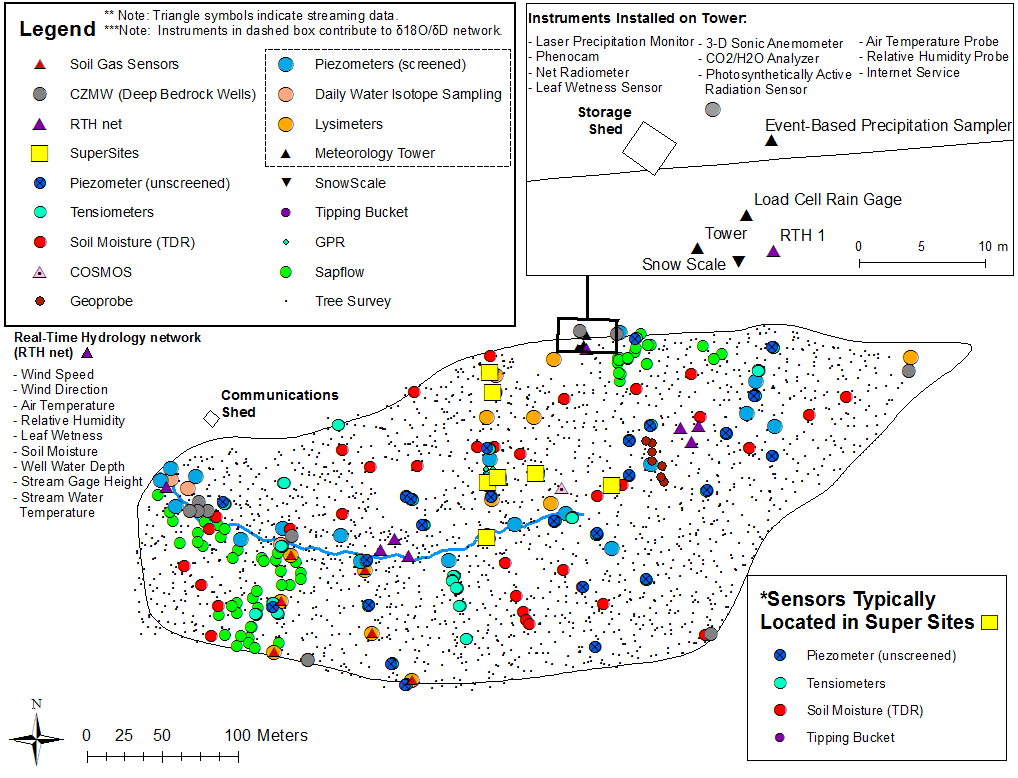
Map of Catchment: Boundary and Instruments - Phase 1 (2007 - 2013)
Please Note: Many instruments are collocated within the catchment. If you select or deselect a layer and do not notice a change at a particular location, it means an instrument from another layer is also at that location. Also, the map has an upper limit of 18 layers. If you select a 19th layer, it will not appear until you deselect another layer.
"Easting" and "Northing" are x and y geographic Cartesian coordinates in the NAD 1983 State Plane Pennsylvania South FIPS 3702 coordinate system. A "false easting" is added to the x-coordinate to eliminate negative values. The basis:
Projection: Lambert Conformal Conic
False Easting: 600000.0
False Northing: 0.0
Central Meridian: -77.75
Standard Parallel 1: 39.93333333333333
Standard Parallel 2: 40.96666666666667
Latitude Of Origin: 39.33333333333334
Linear Unit: Meter
*"Super Sites" typically contain the following instruments: piezometer (unscreened), tensiometers, soil moisture (Time Domain Reflectometry), tipping bucket rain gauge.
Previous static map (PNG file) dated 19 March 2013
Data Categories
Data Levels and Definitions
Level 0 = Raw data - Raw and unprocessed data and data products that have not undergone quality control.
Level 1 = Quality controlled data - Quality controlled data that have passed quality assurance procedures such as routine estimation of timing and sensor calibration or visual inspection and removal of obvious errors.
Level 2 = Derived products - Derived products that require scientific and technical interpretation and may include multiple-sensor data.
Level 3 = Interpreted products - Interpreted products that require researcher driven analysis and interpretation, model-based interpretation using other data and/or strong prior assumptions.
Level 4 = Knowledge products - Knowledge products that require researcher driven scientific interpretation and multidisciplinary data integration and include model-based interpretation using other data and/or strong prior assumptions.

